Maths : Data Interpretation
Q 40 / 46
The following pie charts show the breakup of disease categories recorded in the patients from two towns, Town A and Town B. Pie charts plot the disease categories as percentage of the total number of patients. Based on these, answer the question that follows.
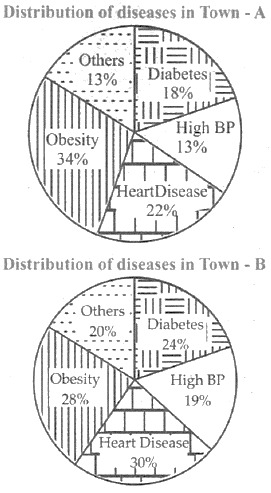
What can we say about persons with more than one disease from these graphs?