- 1CSAT - 2026In a recruitment process, the selection of candidates is based on their performance in three components. The weightages of the components 1, 2 and 3 are 0.2, 0.3 and 0.5, respectively. Use the data given below and find the cutoff score if exactly three candidates are to be selected:
Candidate Score in component 1 Score in component 2 Score in component 3 1 5 4 6 2 4 6 5 3 3 2 8 4 9 4 3 5 8 8 2 - 2CSAT - 2022
A pie chart gives the expenditure on five different items A, B, C, D and E in a household. If B, C, D and E correspond to 90º, 50º, 45º and 75º respectively, then what is the percentage of expenditure on item A?
- 3CSAT - 2021
Consider the following Table:
Player Runs scored in the first Innings Balls faced in the first innings Runs scored in the Second innings Balls faced in the second innings A 61 99 14 76 B 05 12 50 85 C 15 75 20 50 D 13 55 12 50 Who is the fastest run scorer in the Test Match?
- 4CSAT - 2021
A pie diagram shows the percentage distribution of proteins, water and other dry elements in the human body. Given that proteins correspond to 16% and water corresponds to 70%. If both proteins and the other dry elements correspond to p%, then what is the central angle of the sector representing p on the pie diagram?
- 5CSAT - 2020
Consider the following data:
Year Birth rate Death rate 1911–1921 48.1 35.5 1921–1931 46.4 36.3 1931–1941 45.2 31.2 1941–1951 39.9 27.4 1951–1961 41.7 22.8 1961–1971 41.1 18.9 1971–1981 37.1 14.8
For which period was the natural growth rate maximum?
- 6CSAT - 2020
Consider the following data:
Average Marks in English Average marks in Hindi Girls 9 8 Boys 8 7 Overall average marks 8.8 X What is the value of x in the above table?
- 7CSAT - 2018
Consider the following graphs. The curves in the graphs indicate different age group in the populations of two countries A and B over a period of few decades:
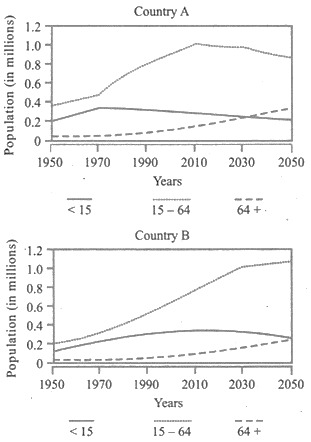
With reference to the above graphs, which of the following are the most logical and rational inferences that can be made?
- Over the last two and a half decades, the dependency ratio for country B has decreased.
- By the end of next two and a half decades, the dependency ratio of country A will be much less than that of country B.
- In the next two decades, the work-force relative to its total population will increase n country B compared to country A.
Select the correct answer using the code given below.
- 8CSAT - 2018
Consider the following figures A and B:
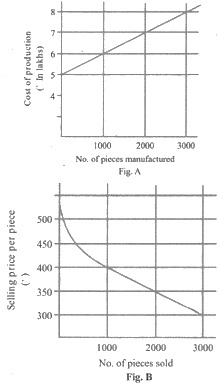
The manufacturing cost and projected sales for a product are shown in the above figure A and B respectively. What is the minimum number of pieces that should be manufactured to avoid a loss?
- 9CSAT - 2018
The following graph shows imports of three different types of steel over a period of six months of a year. Study the graph and answer the questions.
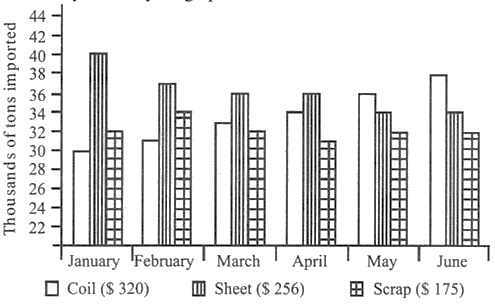
The figures in the brackets indicate the average cost per ton over six months period.
What was the approximate total value (in $) of sheet steel imported over the six months period? - 10CSAT - 2018
The following graph indicates the composition of our tax revenue for a period of two decades:
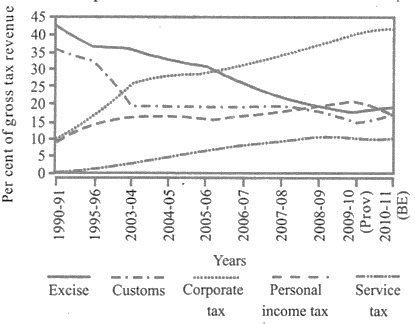
With reference to the above graph, which of the following is/are the most logical and rational inference/ inferences that can be made?
- During the given period, the revenue from Direct Taxes as percentage of gross tax revenue has increased while that of Indirect Taxes decreased.
- The trend in the revenue from Excise Duty demonstrates that the growth of manufacturing sector has been negative during the given period.
Select the correct answer using the code given below.
- 11CSAT - 2018Directions for the following (8-9) items:
Consider the following graph in which the birth rate and death rate of a country are given and answer the two items that follow.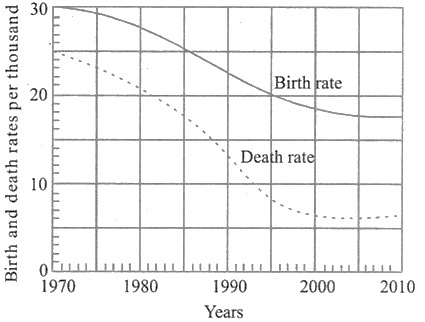
Looking at the graph, it can be inferred that from 1990 to 2010
- 12CSAT - 2018
The figure drawn below gives the velocity graphs of two vehicles A and B. The straight line OKP represents the velocity of vehicle A at any instant, whereas the horizontal straight line. CKD represents the velocity of vehicle B at any instant. In the figure, D is the point where perpendicular from P meets the horizontal line CKD such that PD =
 LD:
LD: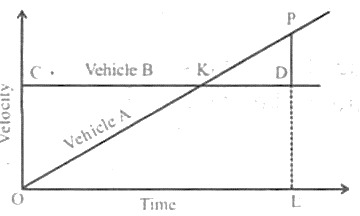
What is the ratio between the distances covered by vehicles A and B in the time internal OL?
- 13CSAT - 2018
With reference to the above graph, consider the following statements considering 1970 as base year:
- Population has stabilized after 35 years.
- Population growth rate has stabilized after 35 years.
- Death rate has fallen by 10% in the first 10 years.
- Birth rate has stabilized after 35 years.
Which of the above are the most logical and rational statements that can be made from the above graph?
- 14CSAT - 2018
The following table gives the GDP growth rate and Tele-density data of different States of a country in a particular year. Study the table and answer the question:
States Per capita income
($)GDP growth rate
(%)Tele-density State 1 704 9.52 70.27 State 2 419 5.31 35.88 State 3 254 10.83 50.07 State 4 545 9.78 5.94 State 5 891 10.8 76.12 State 6 1077 11.69 77.5 State 7 900 8.88 104.86 State 8 395 5.92 6 State 9 720 7.76 82.25 State 10 893 9.55 96.7 State 11 363 4.7 57.7 State 12 966 7.85 63.8 State 13 495 9.37 52.3 State 14 864 5.46 97.9 State 15 497 7.48 62.3 State 16 777 7.03 93.8 State 17 335 5.8 49.9 State 18 599 7.49 47.84 With reference to the above table, the following assumptions have been made:
- Now a days, prosperity of an already high performing State cannot be sustained without making further large investments in its telecom infrastructure.
- Nowadays, a very high Tele-density is the most essential condition for promoting the business and economic growth in a State.
Which of the above assumptions is/are valid?
- 15CSAT - 2018
The following table gives the GDP growth rate and Tele-density data of different States of a country in a particular year. Study the table and answer the question:
States Per capita income
($)GDP growth rate
(%)Tele-density State 1 704 9.52 70.27 State 2 419 5.31 35.88 State 3 254 10.83 50.07 State 4 545 9.78 5.94 State 5 891 10.8 76.12 State 6 1077 11.69 77.5 State 7 900 8.88 104.86 State 8 395 5.92 6 State 9 720 7.76 82.25 State 10 893 9.55 96.7 State 11 363 4.7 57.7 State 12 966 7.85 63.8 State 13 495 9.37 52.3 State 14 864 5.46 97.9 State 15 497 7.48 62.3 State 16 777 7.03 93.8 State 17 335 5.8 49.9 State 18 599 7.49 47.84 With reference to the above table, which of the following is/are the most logical and rational inference/inference that can be made?
- Higher per capita income is generally associated with higher Tele-density.
- Higher GDP growth rate always ensures higher per capita income.
- Higher GDP growth rate does not necessarily ensure higher Tele-density.
Select the correct answer using the code given below.
- 16CSAT - 2018
Consider the following graph:
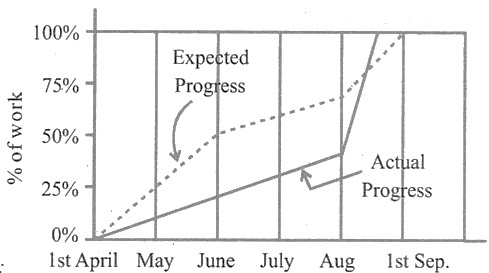
Which one of the following statements is not correct with reference to the graph given above?
- 17CSAT - 2018
The graph given below indicates the changes in Key policy rates made by the Central Bank several times in a year
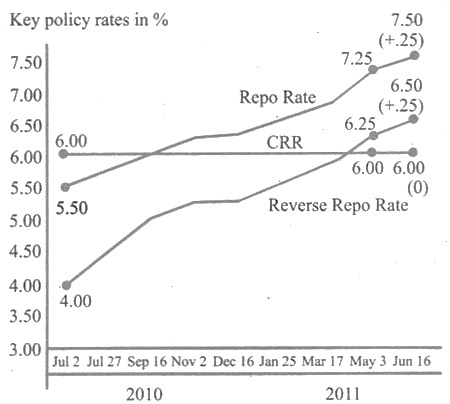
Which one of the following can be the most likely reason for the Central Bank for such an action?
- 18CSAT - 2018
The following graph shows imports of three different types of steel over a period of six months of a year. Study the graph and answer the questions.
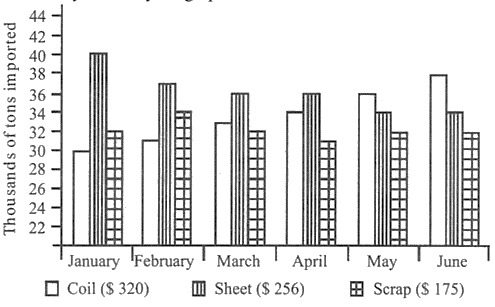
The figures in the brackets indicate the average cost per ton over six months period.
By how much (measured in thousands of tons) did the import of sheet steel exceed the import of coil steel in the first three months of the year? - 19CSAT - 2018
The following graph shows imports of three different types of steel over a period of six months of a year. Study the graph and answer the questions.
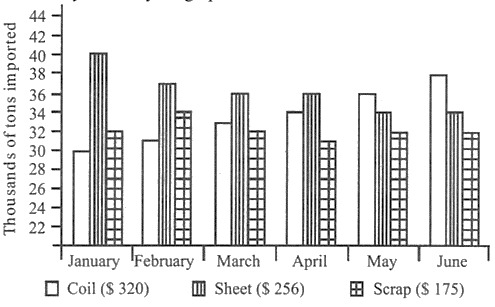
The figures in the brackets indicate the average cost per ton over six months period.
What was the approximate ratio of sheet steel and scrap steel imports in the first three months of the year? - 20CSAT - 2018
Average hourly earnings per year (E) of the workers in a firm are represented in figure A and B as follows:
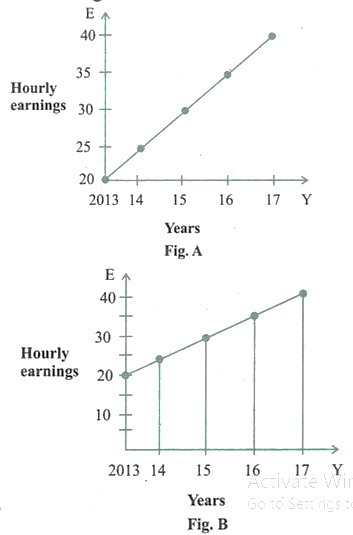
From the figures, it is observed that the
- 21CSAT - 2015
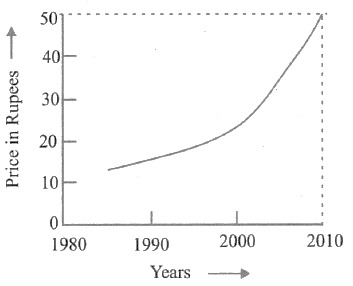
Year-wise variation of the price of a certain commodity is shown in the following graph:
The price of the commodity in the year 1990
- 22CSAT - 2015
The graph below depicts the earnings of A and B over the period 2000 to 2010:
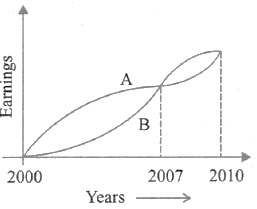
From the graph, which one of the following can be concluded?
- 23CSAT - 2015
The proportion of expenditure on various items by two families A and B are represented in the following Bar Charts:
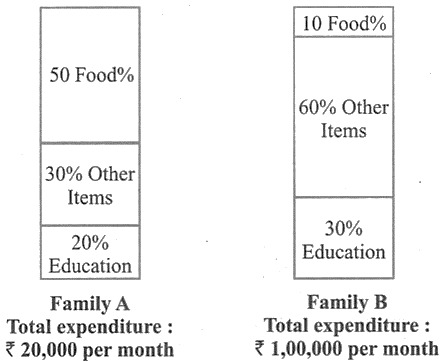
From these charts, we can conclude that
- 24CSAT - 2014
The following table gives population and total income of a city for four years:
Years 1992 1993 1994 1995 Populations in Lakhs 20 21 22 23 Income in crore (Rs) 1010 1111 1225 1345 Which one of the following statements is correct in respect of the above data?
- 25CSAT - 2014
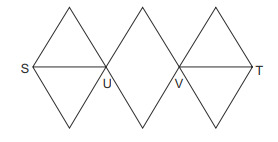
With reference to the figure given below, the number of different routes from S to T without retracing from U and/or V, is
- 26CSAT - 2014
The following graph shows the average profit of two fruit-sellers A and B in thousands (Rs) per year five the year 1995 to 2000. Consider the graph and answer the question:
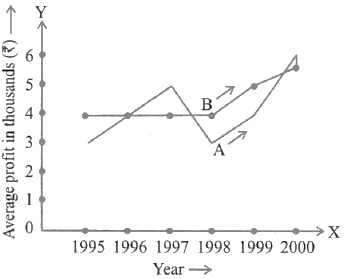
In which year is the average profit of A and B same?
- 27CSAT - 2014
The following graph shows the average profit of two fruit-sellers A and B in thousands (Rs) per year five the year 1995 to 2000. Consider the graph and answer the question:
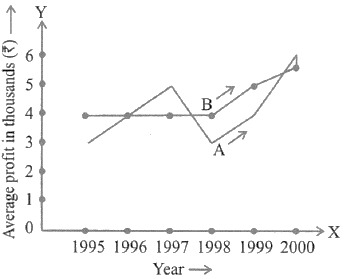
How much more average profit did A make in the year 2000 than in the year 1999?
- 28CSAT - 2014
The following table shows the marks obtained by two students in different subjects:
Student A Maximum marks Student B Maximum marks English 60 100 80 150 Psychology 70 100 70 100 History 50 100 60 100 Sanskrit 30 50 15 25 The difference in the mean aggregate percentage marks of the students is
- 29CSAT - 2014
The following graph shows the average profit of two fruit-sellers A and B in thousands (Rs) per year five the year 1995 to 2000. Consider the graph and answer the question:
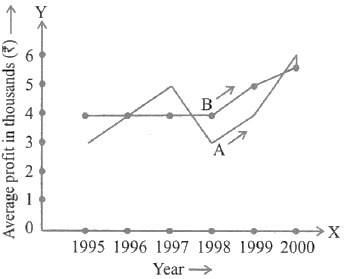
What is the difference between the average profit of B and A in the year 1998?
- 30CSAT - 2014
The following graph shows the average profit of two fruit-sellers A and B in thousands (Rs) per year five the year 1995 to 2000. Consider the graph and answer the question:
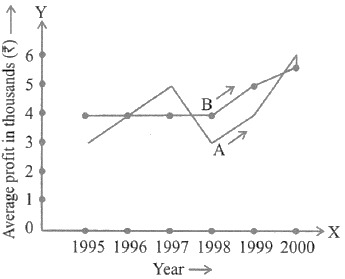
What is the trend of the average profit of B from the year 1997 to the year 2000?
- 31CSAT - 2013
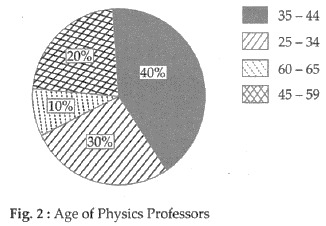
Study the two figures given below and answer the question that follow:
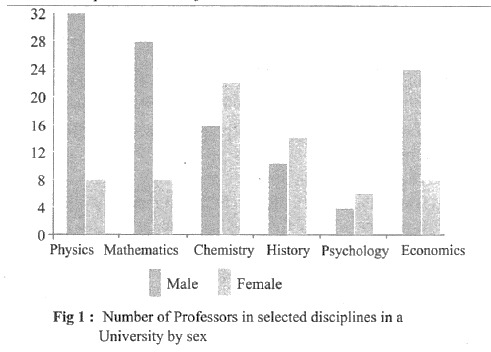
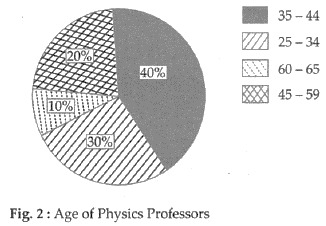
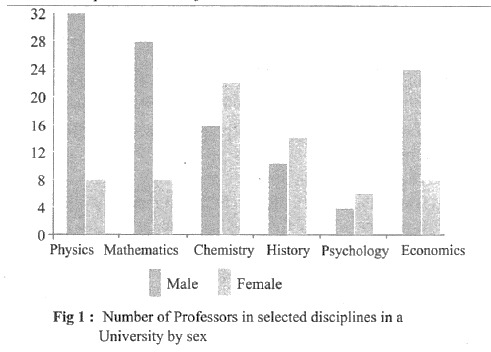
What percentage of all Psychology professors are females?
- 32CSAT - 2013
Study the two figures given below and answer the question that follow:
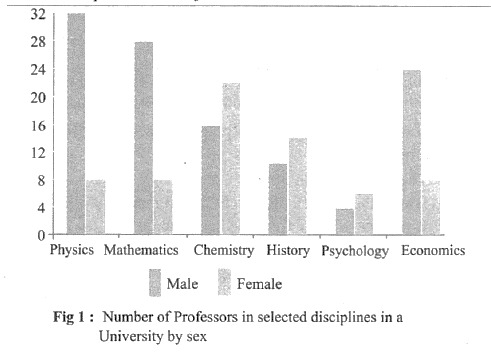
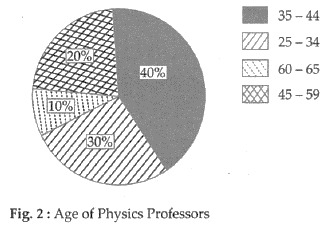
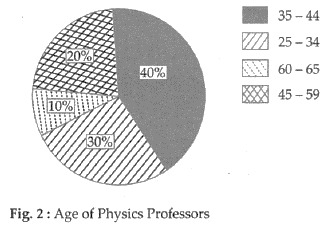
How many Physics professors belong to the age group 35-44?
- 33CSAT - 2013
Study the two figures given below and answer the question that follow:
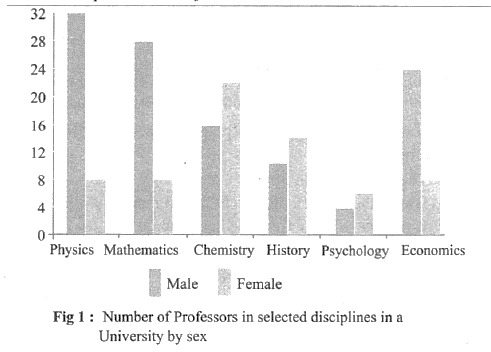
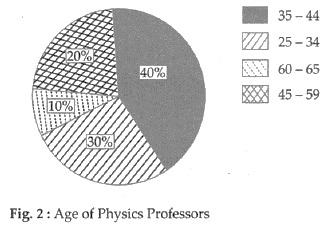
If the number of female Physics professors in the age group 25 — 34 equals 25% of all the Physics professors in that age group, then what is the number of male Physics professors in the age group 25-34?
- 34CSAT - 2013
Study the two figures given below and answer the question that follow:
If the Psychology professors in the University constitute 2% of all the professors in the University, then what is the number of professors in the University?
- 35CSAT - 2013
Four cars are hired at the rate of ₹ 6 per km plus the cost of diesel at ₹ 40 a litre. In this context, consider the details given in the following table?
Car Mileage (km/l) Horse Total Payments (₹) A 8 20 2120 B 10 25 1950 C 9 24 2064 D 11 22 1812
Which car maintained the maximum average speed?
- 36CSAT - 2013
Study the two figures given below and answer the question that follow:
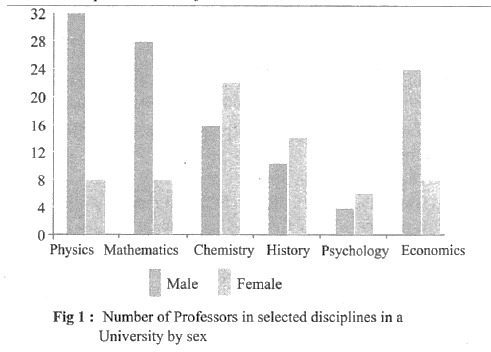
Which one of the following disciplines has the highest ratio of males to females?
- 37CSAT - 2012
Consider the following information regarding the performance of a class of 1000 students in four different tests:
Test I II III IV Average marks 60 60 70 80 Range of marks 30 to 90 45 to 75 20 to 100 0 to 100 If a student scores 74 marks in each of the four tests, in which one of the following tests is her performance the best comparatively?
- 38CSAT - 2011
The following pie charts show the breakup of disease categories recorded in the patients from two towns, Town A and Town B. Pie charts plot the disease categories as percentage of the total number of patients. Based on these, answer the question that follow.
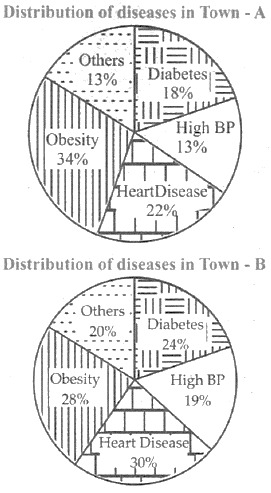
Which of the two towns has a higher number of persons with Diabetes?
- 39CSAT - 2011
The following figure has four curves namely A, B, C and D.
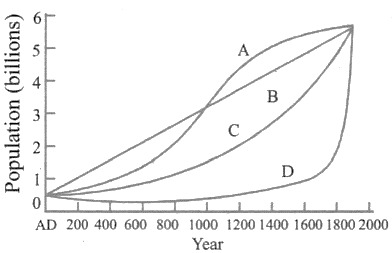
Study the figure and answer the item that follows.
Which curve indicates the exponential growth?
- 40CSAT - 2011
The following pie charts show the breakup of disease categories recorded in the patients from two towns, Town A and Town B. Pie charts plot the disease categories as percentage of the total number of patients. Based on these, answer the question that follows.
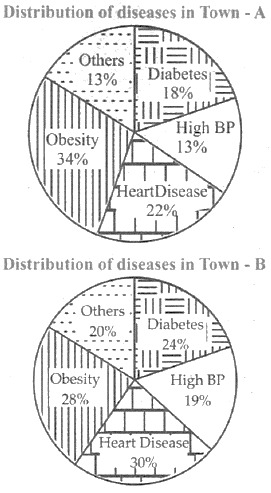
What can we say about persons with more than one disease from these graphs?
- 41CSAT - 2011
Consider the following distance- time graph. The graph shows three athletes A, B and C running side by side for a 30 km race.
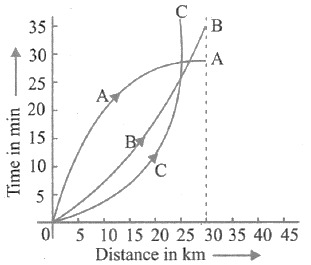
With reference to the above graph, consider the following statements:
- The race was won by A.
- B was ahead mark of A up to 25 km mark
- C ran very slowly from the beginning.
Which of the statements given above is/are correct?
- 42CSAT - 2011
Read the passage given below, study the graph that follows and answer the question.
During a party, a person was exposed to contaminated water. A few days later, he developed fever and loose motions. He suffered for some days before going to a doctor for treatment. On starting the treatment, he soon became better and recovered completely a few days later. The following graph shows different phases of the person's disease condition as regions A, B, C, D and E of the curve.
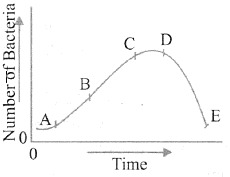
Which region of the curve indicates that the treatment yielded effective relief?
- 43CSAT - 2011
Read the passage given below, study the graph that follows and answer the question.
During a party, a person was exposed to contaminated water. A few days later, he developed fever and loose motions. He suffered for some days before going to a doctor for treatment. On starting the treatment, he soon became better and recovered completely a few days later. The following graph shows different phases of the person's disease condition as regions A, B, C, D and E of the curve.
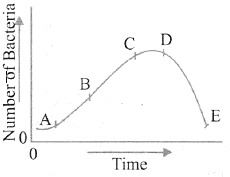
Which region of the curve indicates that the person began showing the symptoms of infection?
- 44CSAT - 2011
Read the passage given below, study the graph that follows and answer the question.
During a party, a person was exposed to contaminated water. A few days later, he developed fever and loose motions. He suffered for some days before going to a doctor for treatment. On starting the treatment, he soon became better and recovered completely a few days later. The following graph shows different phases of the person's disease condition as regions A, B, C, D and E of the curve.
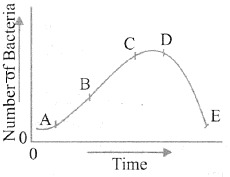
Which region/regions of the curve correspond/corresponds to incubation phase of the infection?
- 45CSAT - 2011
Consider the following Velocity — Time graph. It shows two trains starting simultaneously on parallel tracks.
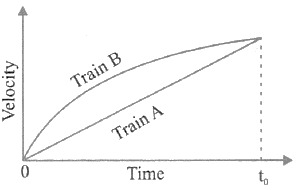
With reference to the above graph, which one of the following statements is not correct?
- 46CSAT - 2011
Consider the four age pyramids given below namely A, B, C and D representing four different countries.
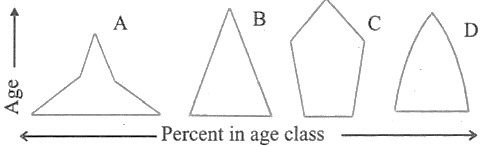
Which one of them indicates the declining population?