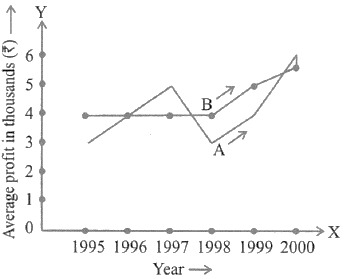
The following graph shows the average profit of two fruit-sellers A and B in thousands (Rs) per year five the year 1995 to 2000. Consider the graph and answer the question:
How much more average profit did A make in the year 2000 than in the year 1999?