Maths : Data Interpretation
Q 11 / 46
Directions for the following (8-9) items:
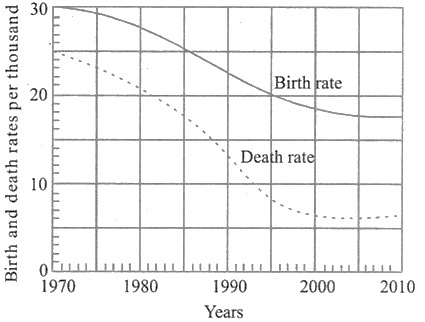
Consider the following graph in which the birth rate and death rate of a country are given and answer the two items that follow.
Looking at the graph, it can be inferred that from 1990 to 2010
A
population growth rate has increased
B
population growth rate has decreased
C
growth rate of population has remained stable
D
population growth rate shows no trend