Maths : Data Interpretation
Q 9 / 46
The following graph shows imports of three different types of steel over a period of six months of a year. Study the graph and answer the questions.
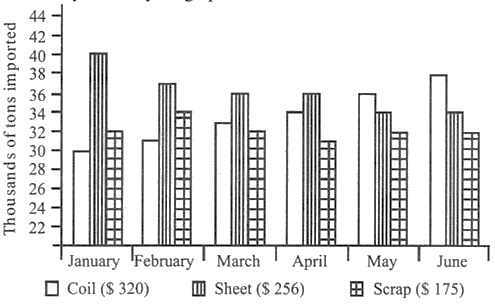
The figures in the brackets indicate the average cost per ton over six months period.
What was the approximate total value (in $) of sheet steel imported over the six months period?