Maths : Data Interpretation
Q 33 / 46
Study the two figures given below and answer the question that follow:
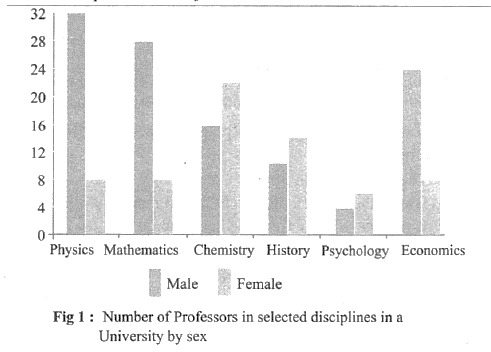
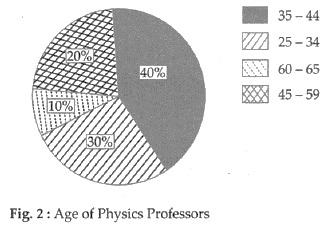
If the number of female Physics professors in the age group 25 — 34 equals 25% of all the Physics professors in that age group, then what is the number of male Physics professors in the age group 25-34?