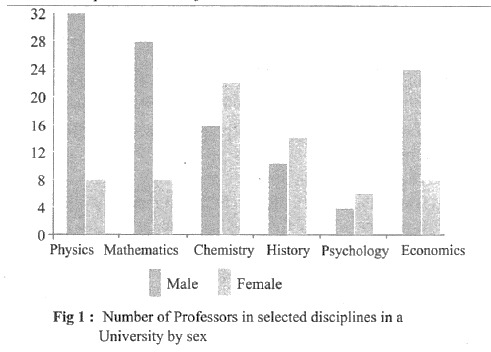
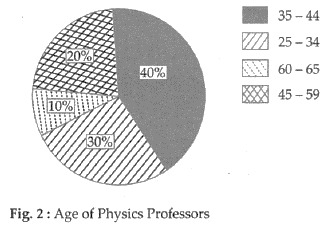
Study the two figures given below and answer the question that follow:
If the Psychology professors in the University constitute 2% of all the professors in the University, then what is the number of professors in the University?