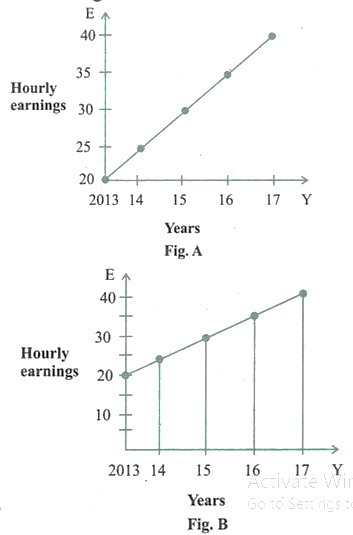
Average hourly earnings per year (E) of the workers in a firm are represented in figure A and B as follows:
From the figures, it is observed that the