Maths : Data Interpretation
Q 19 / 46
The following graph shows imports of three different types of steel over a period of six months of a year. Study the graph and answer the questions.
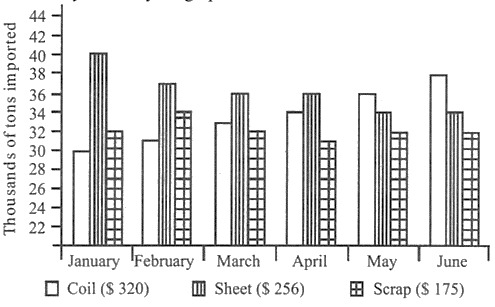
The figures in the brackets indicate the average cost per ton over six months period.
What was the approximate ratio of sheet steel and scrap steel imports in the first three months of the year?